
New York Coffee Sales Analysis
Objective
The primary objective of this project is to analyze coffee sales trends across different store locations in New York, identify high-performing product categories, and provide insights into customer preferences over time. By leveraging sales data, this analysis helps optimize inventory management, improve sales strategies, and enhance business decision-making.
Key Goals
- Track coffee sales trends over time to identify peak sales periods.
- Analyze sales performance by product category to determine top-selling items.
- Compare sales performance across store locations to identify regional preferences.
- Provide actionable insights to improve stock availability and maximize revenue.
Tools Used
- ✓ SQL – Extracted and transformed sales data from the database.
- ✓ Excel – Cleaned and structured data before loading into Power BI.
- ✓ Power BI – Designed an interactive dashboard for sales analysis.
Dashboard Breakdown
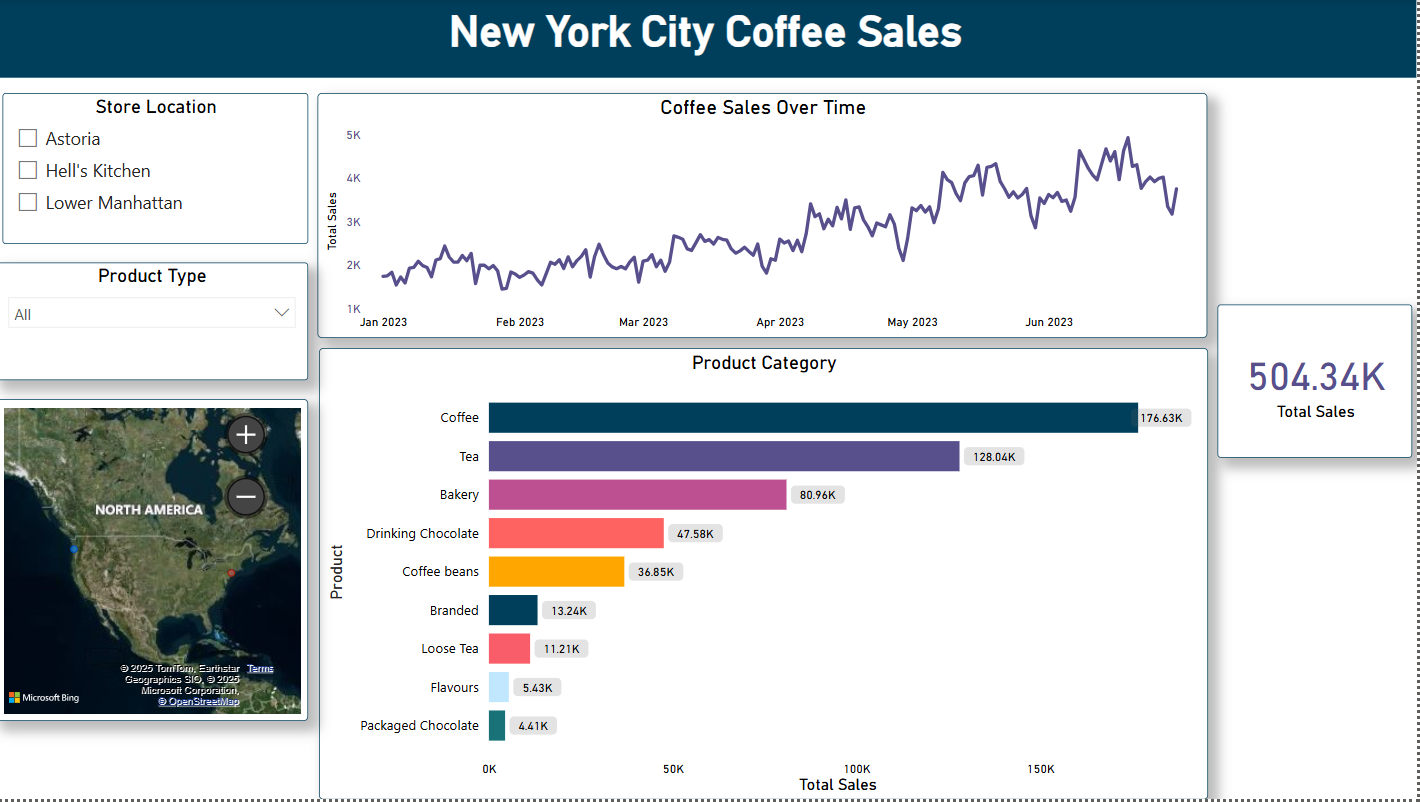
1. Coffee Sales Over Time
- A line chart visualizes total sales trends from January to June 2023.
- There is a noticeable upward trend, with fluctuations indicating seasonal demand.
- Peaks in sales could be linked to promotional campaigns, holidays, or weather patterns.
2. Product Category Performance
- A bar chart categorizes total sales by product type, revealing high-demand items.
- Top performers: Coffee (176.63K), Tea (128.04K), and Bakery items (80.96K).
- Lower-performing items such as Flavours (5.43K) and Packaged Chocolate (4.41K) may require strategic pricing or promotional offers to boost sales.
3. Store Location & Product Type Filters
- Filters allow dynamic analysis based on:
- ✓ Store Location (Astoria, Hell's Kitchen, Lower Manhattan) to compare regional sales trends.
- ✓ Product Type (e.g., Barista Espresso, Biscotti, Drip Coffee) for detailed product-level insights.
4. Total Sales KPI
- A KPI card highlights total sales of 504.34K, providing a quick overview of revenue performance.
5. Geographic Sales Distribution
- A map visualization powered by Bing Maps displays store locations across the U.S., helping identify geographic sales distribution.
Business Impact & Insights
✔ Optimizing Stock & Inventory
- Understanding top-selling products ensures optimal stock levels, preventing shortages.
- Underperforming products may require discounts, bundling, or marketing adjustments.
✔ Regional Sales Strategy
- Sales data per store location enables targeted marketing and promotional efforts.
- High-performing regions can serve as models for underperforming areas.
✔ Seasonal Demand Planning
- The time-series analysis of coffee sales helps businesses prepare for peak sales periods.
- Seasonal trends can be leveraged to introduce limited-time offers and promotions.
✔ Enhancing Customer Experience
- Identifying popular product types helps tailor offerings to customer preferences.
- Personalized recommendations and loyalty programs can drive repeat purchases.
Conclusion
By integrating SQL, Excel, and Power BI, this dashboard provides a data-driven approach to sales analysis, offering valuable insights into product performance, regional demand, and seasonal sales trends. These insights empower business managers to make informed decisions, optimize sales strategies, and improve overall revenue growth in the competitive New York coffee market.
 Visit My GitHub Profile